Dynatrace Logging
Introduction
This document serves as a guide for using Dynatrace Log Monitoring in the NGSS environment. It explains how to access, query, and export logs using the Dynatrace Log Viewer Classic.
Accessing the Log Viewer
-
Sign in to the appropriate Dynatrace environment:
-
Production: NGSS Dynatrace Production
-
SQA: NGSS Dynatrace SQA
-
-
In the Dynatrace menu, go to:
Observe and explore → Logs -
Confirm you’re viewing the correct environment using the selector in the top-right corner.
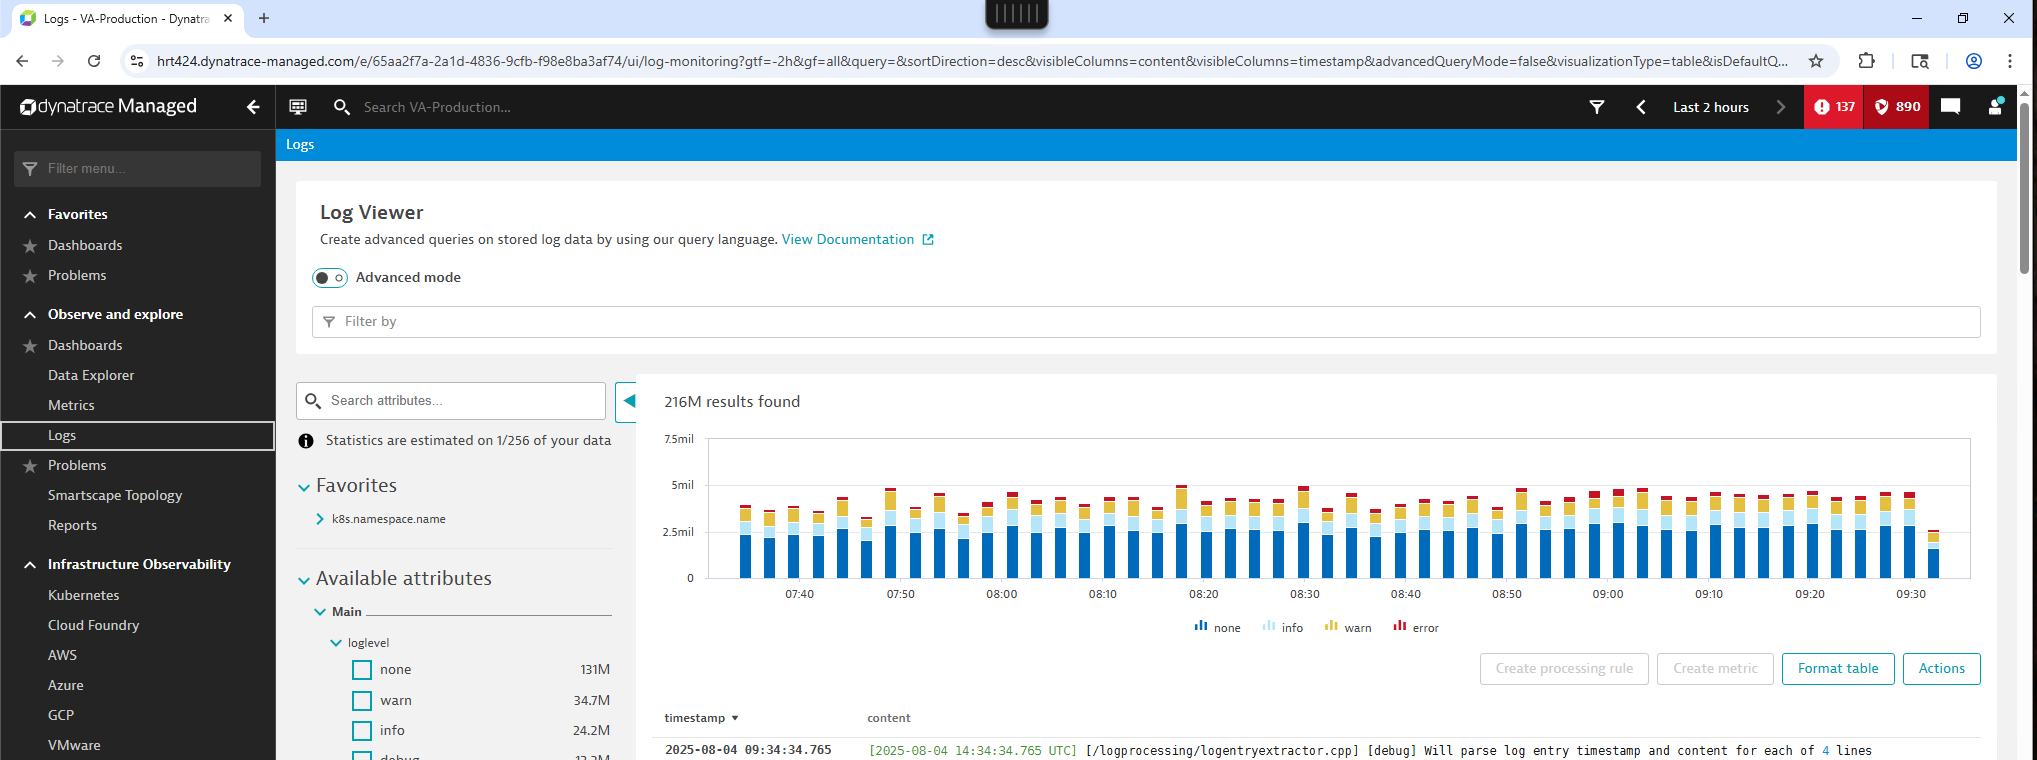
Querying Logs
Dynatrace supports two primary methods for querying logs:
-
UI filters: Quick field-based filtering
-
Advanced mode: Using Log Query Language (LQL)
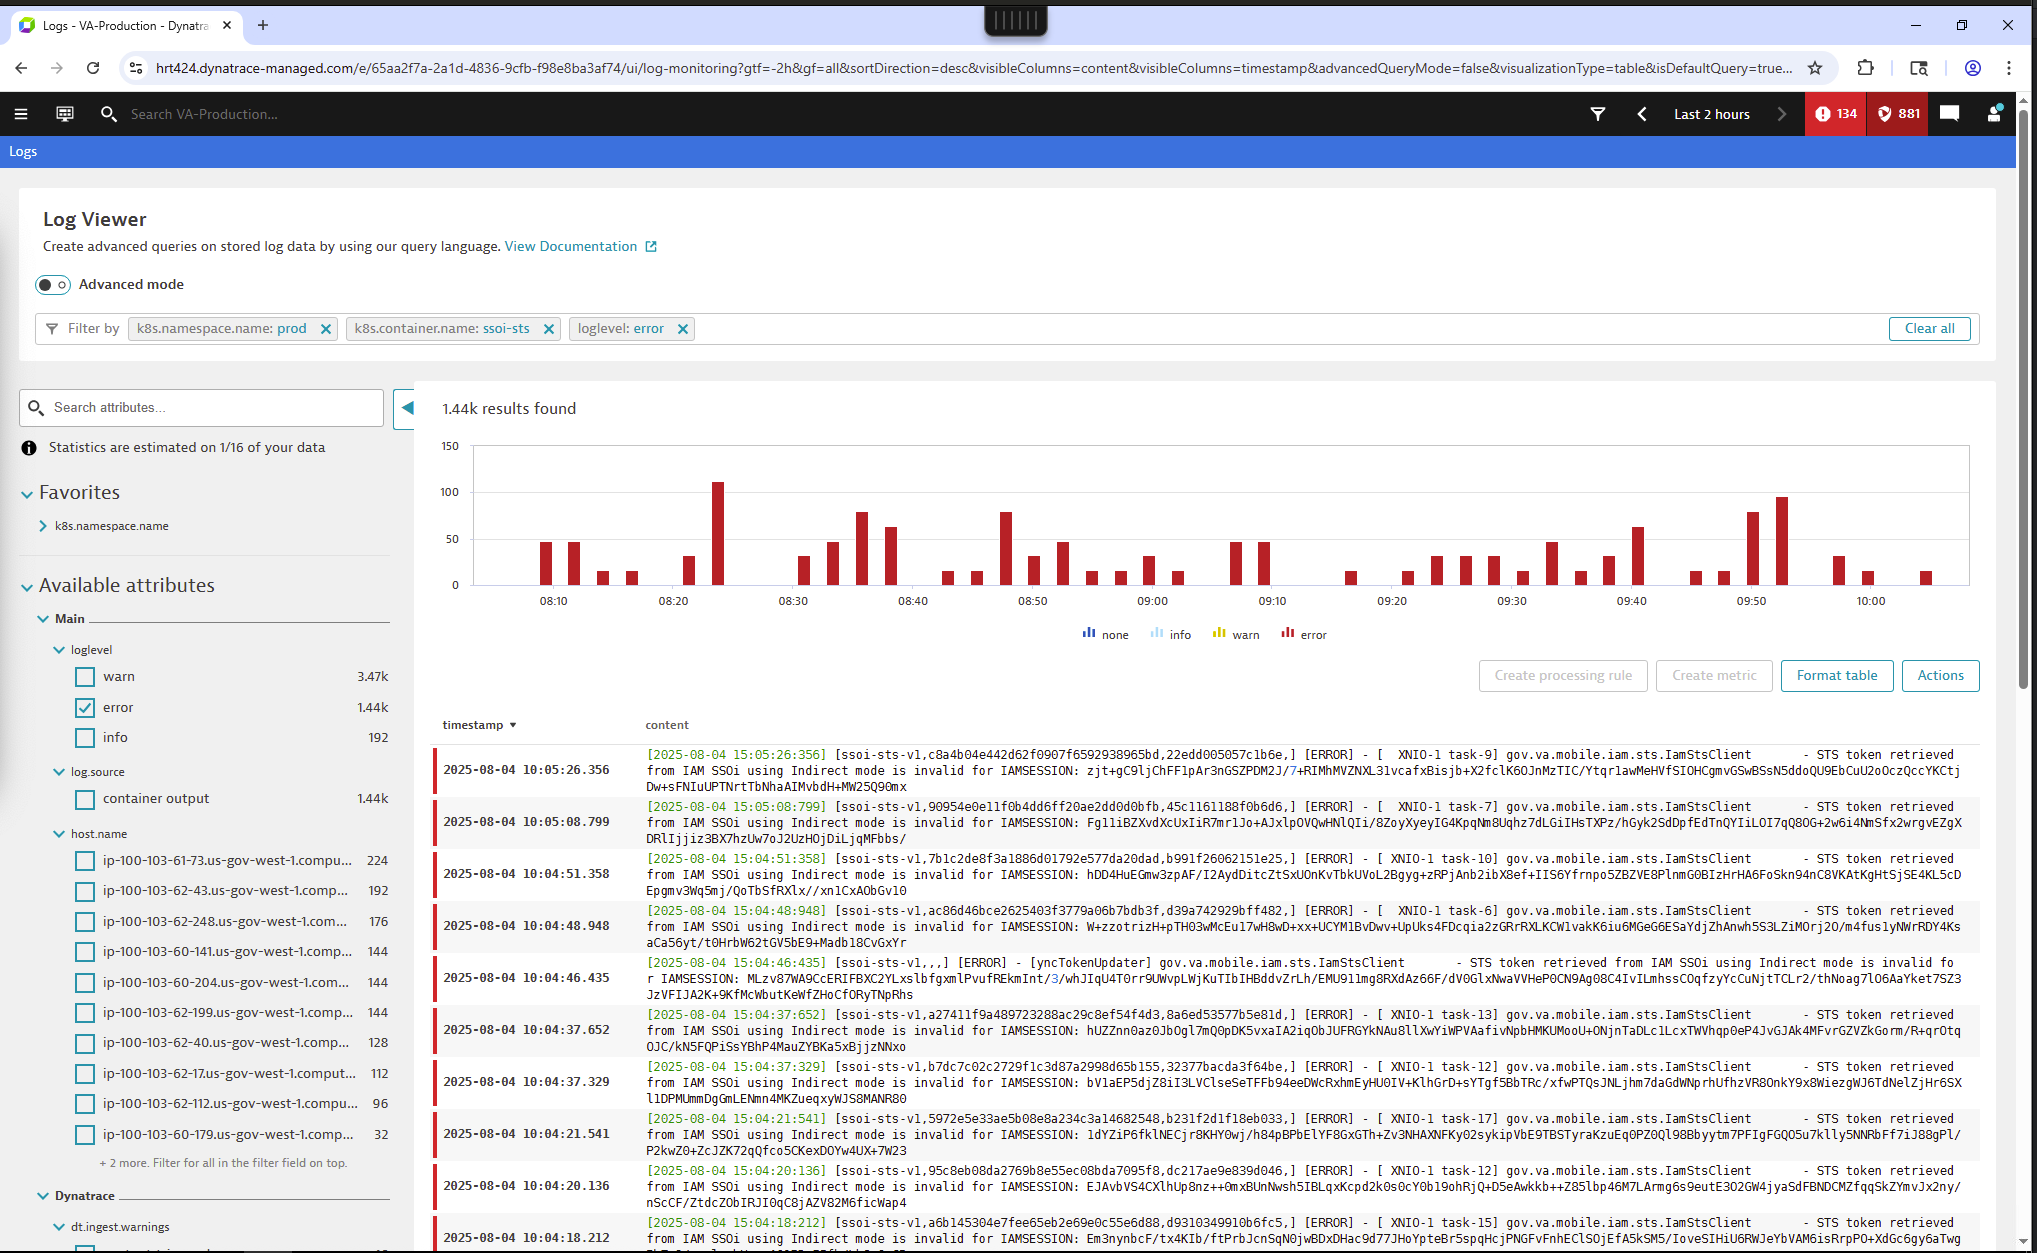
Basic Filtering
Common fields for filtering:
-
k8s.namespace.name == "prod" -
k8s.container.name == "ssoi-sts" -
loglevel == "ERROR"
Use multiple filters with logical operators (AND, OR).
Advanced Querying with LQL
Enable advanced mode by clicking Switch to advanced mode in the Log Viewer.
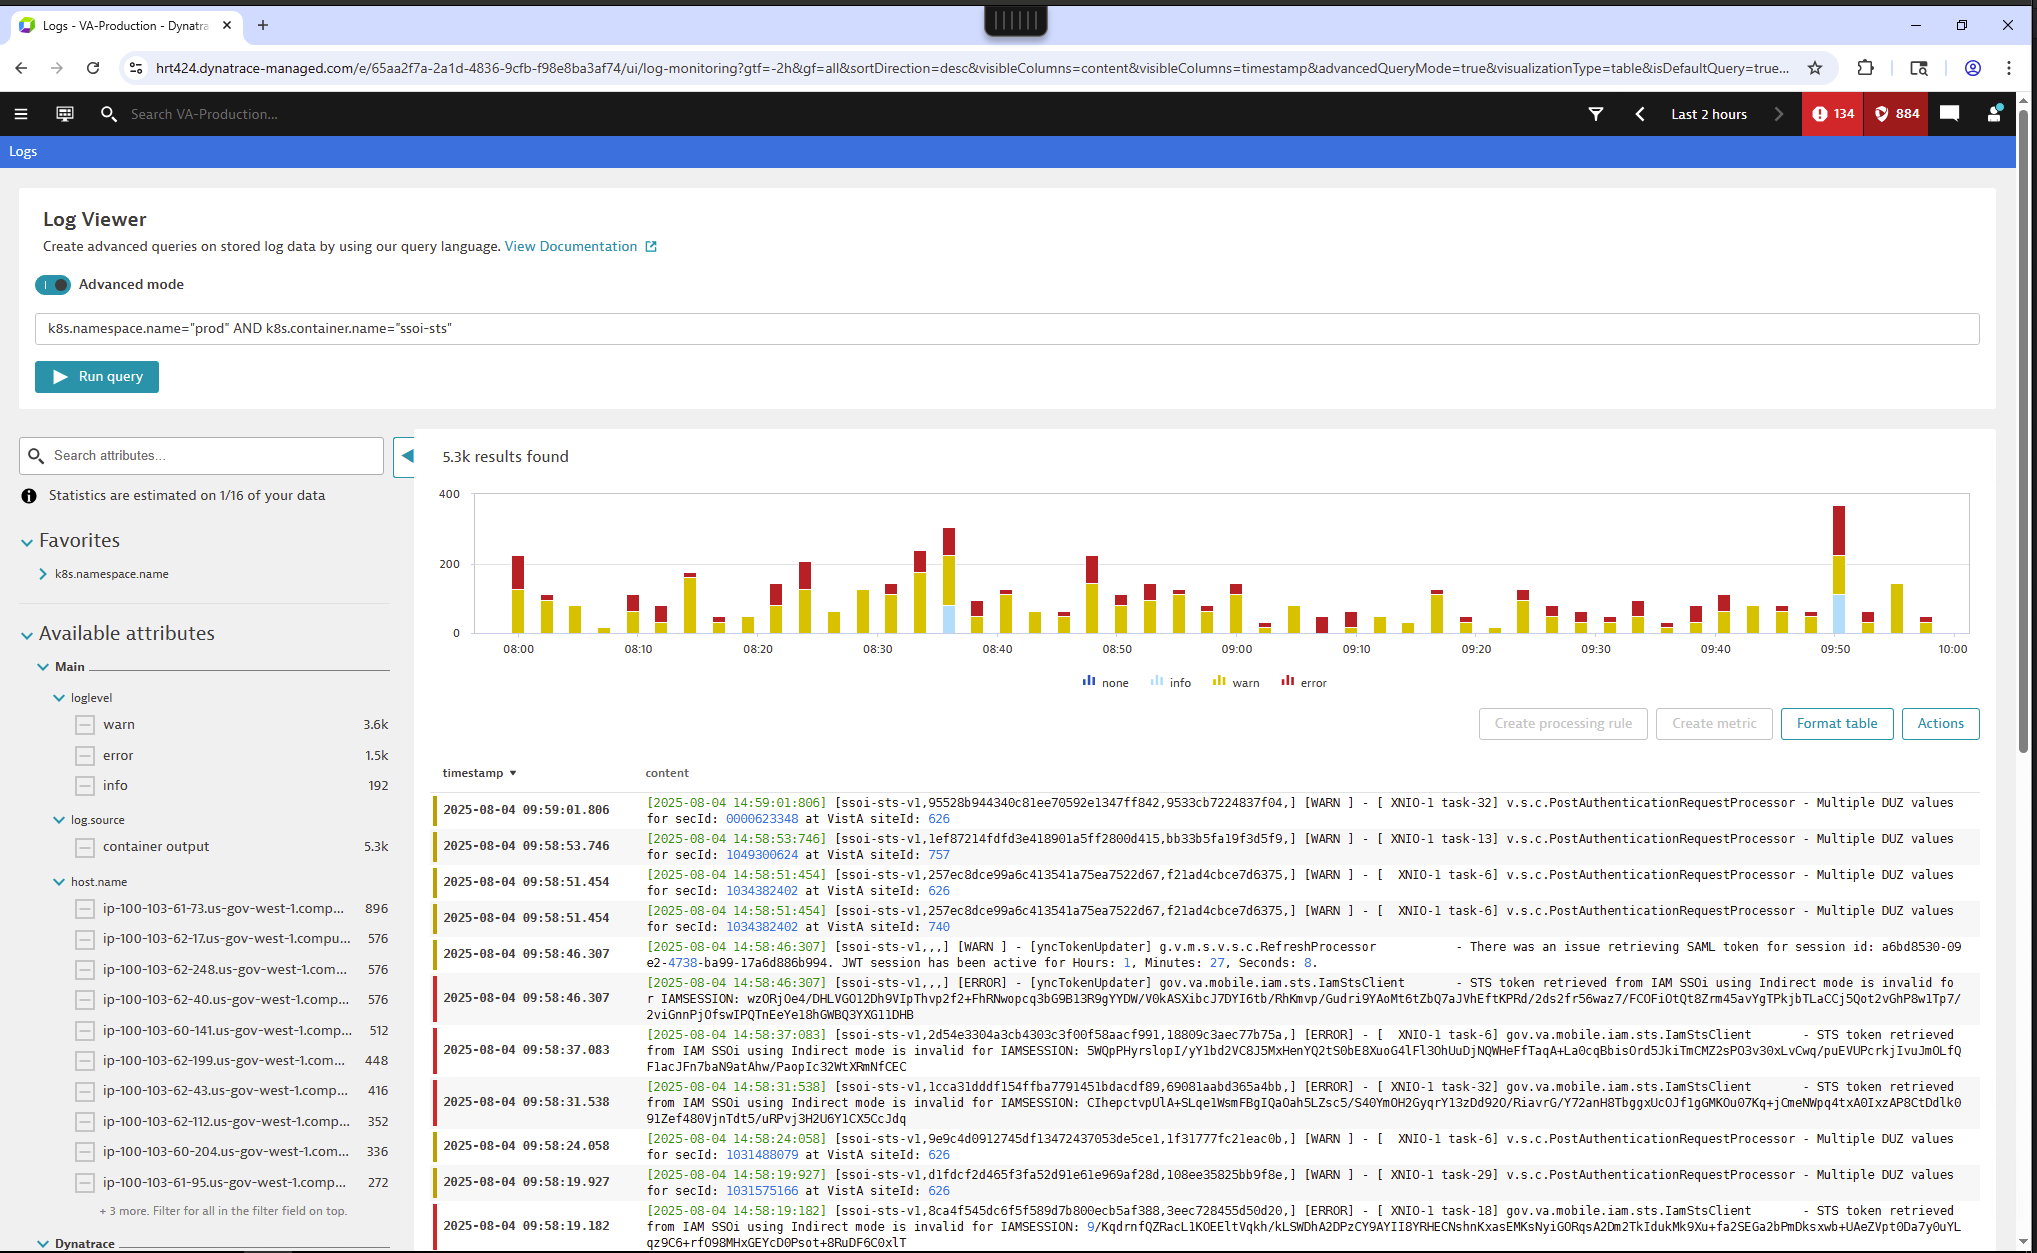
Logs with error messages:
loglevel == "ERROR" AND content contains "connection refused"Combine fields and operators:
loglevel = "ERROR" OR loglevel = "WARN" AND k8s.container.name contains "worker"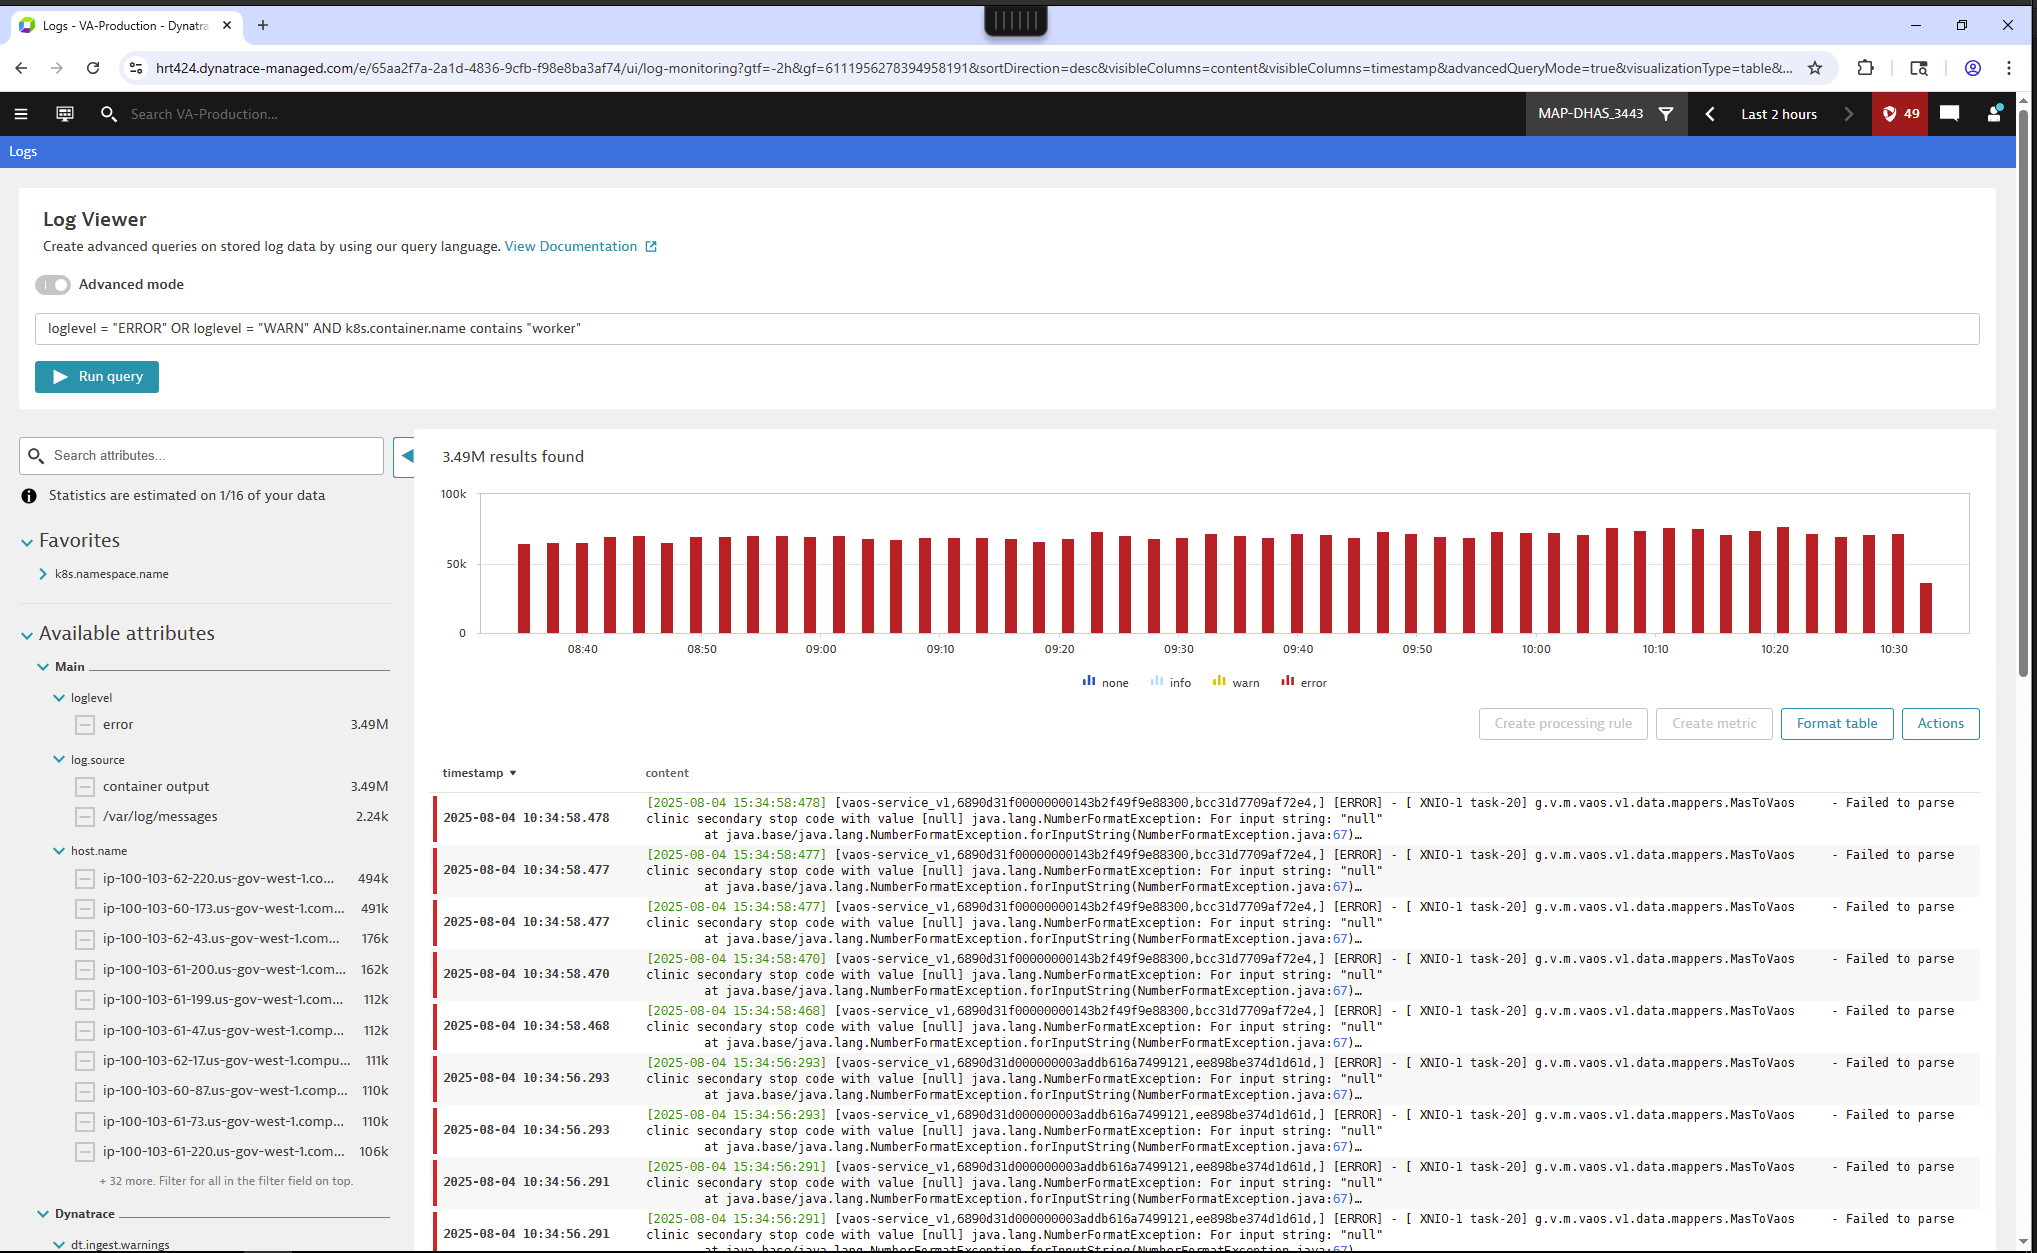
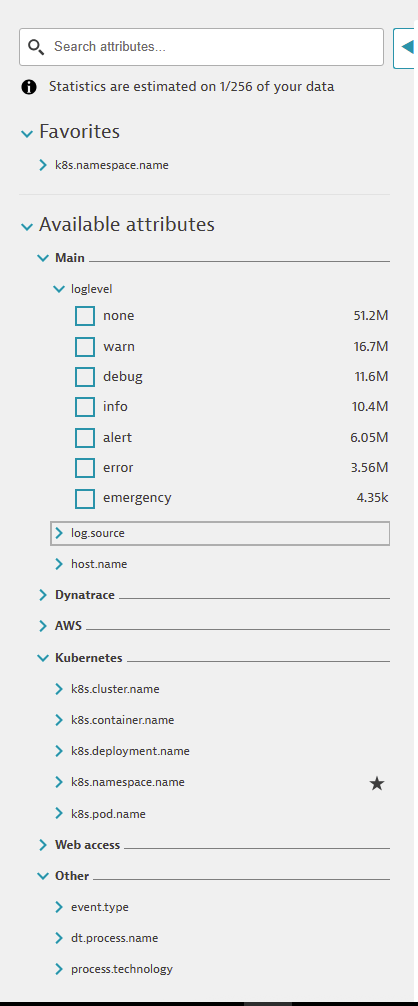
Filtering & Field Reference
Below are commonly used log fields:
| Field | Description |
|---|---|
|
Severity level (INFO, WARN, ERROR) |
|
K8s Cluster |
|
K8s namespace |
|
K8s deployment |
|
Container name |
Use the "Fields" tab in the Log Viewer UI to discover available fields in your logs.
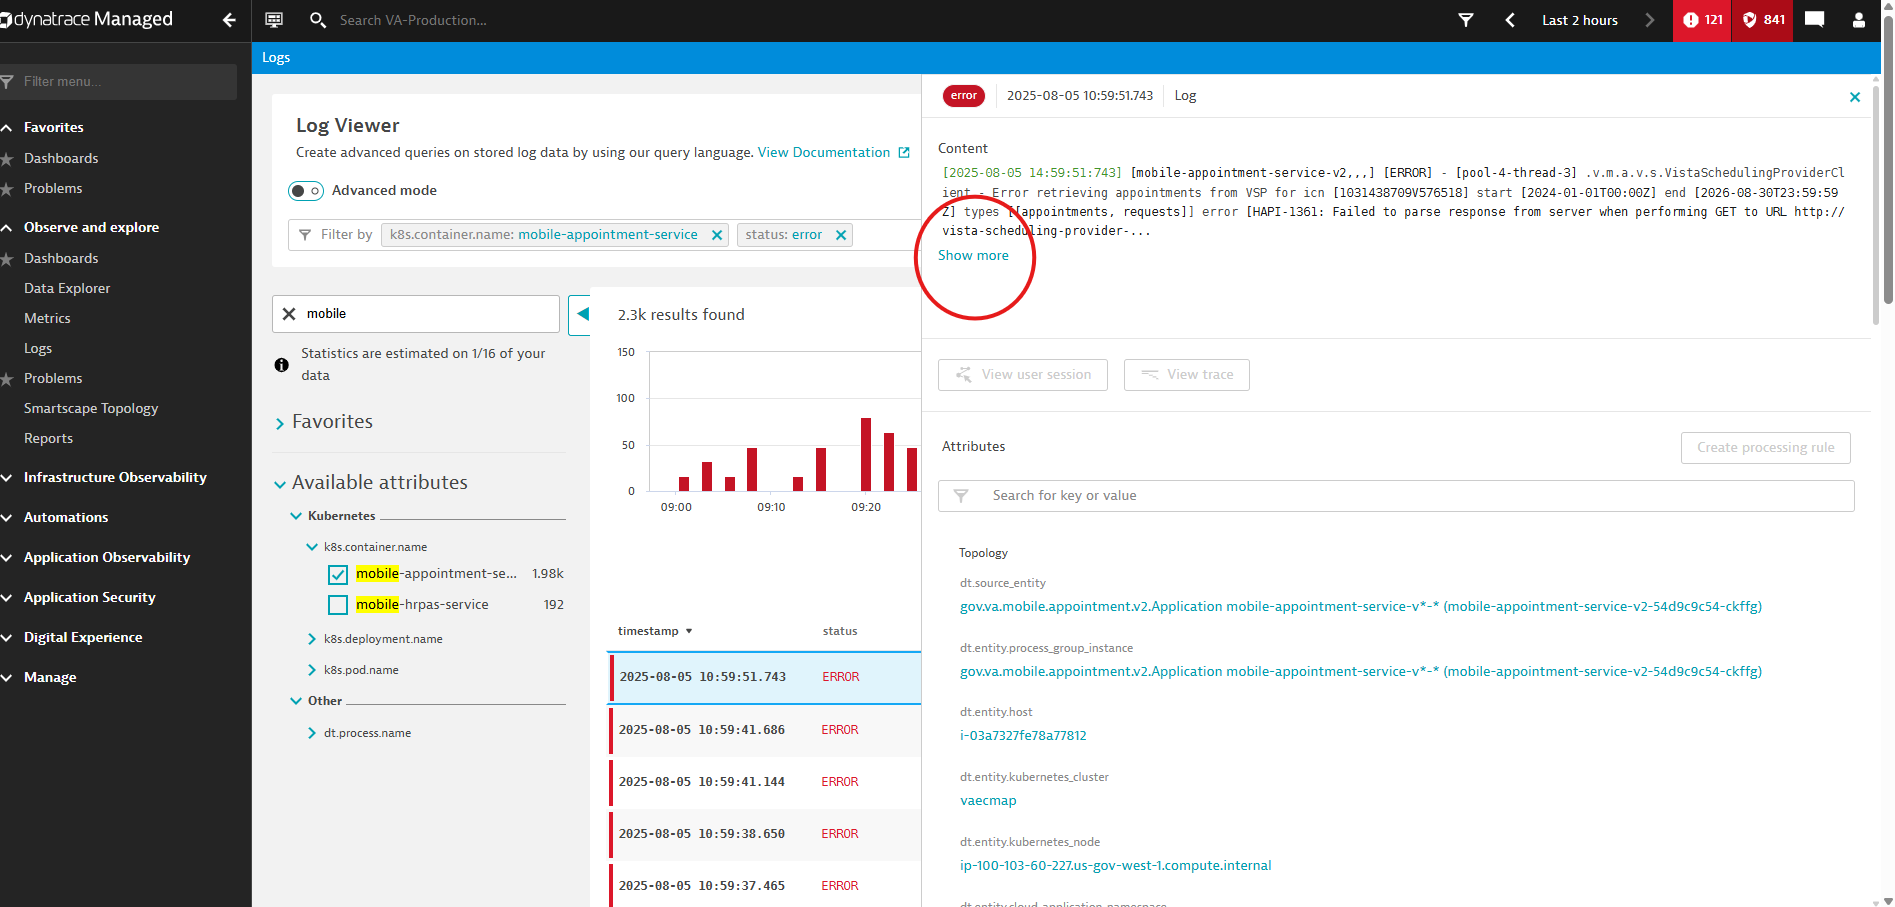
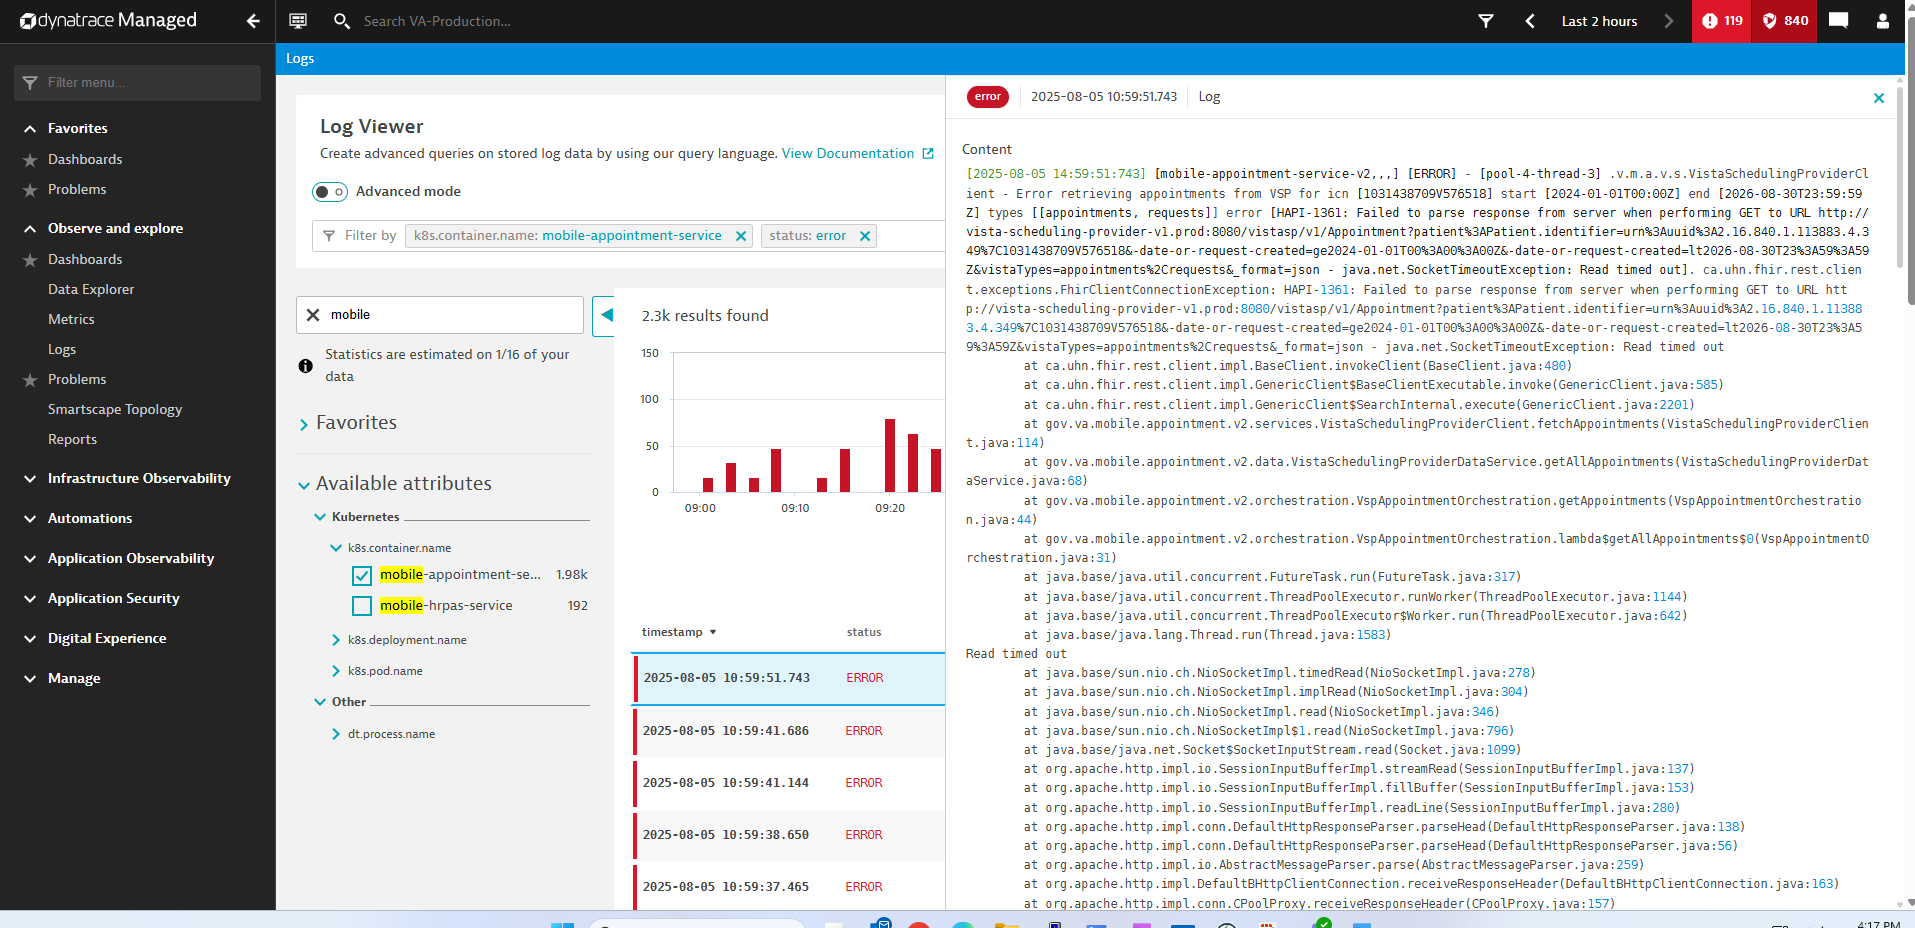
Log Details
Below are screenshots showing the full stack trace, if applicable, and the parsed fields of a log message.
Format Table
The Format table option allows users to customize the columns displayed in the results table by selecting from a list of Dynatrace-generated and reserved log attributes—such as dt.entity.process_group—to tailor visibility and support further use (e.g., as dimensions when creating log metrics). Simply tick or untick the checkboxes to show or hide the corresponding columns in the table, ensuring that only relevant attributes are surfaced for analysis and reporting.
Troubleshooting Tips
- No logs showing up?
-
-
Confirm the correct environment is selected.
-
Use a broader time window or remove restrictive filters.
-
Verify your application writes logs to stdout/stderr.
-
- Metadata fields missing?
-
-
Ensure OneAgent is running in full-stack mode.
-
Check log enrichment settings in Dynatrace settings under
Log Monitoring → Processing rules.
-
- Slow queries or dropped logs?
-
-
Reduce the time range and simplify the query.
-
Validate that log quota or retention settings are not limiting results.
-
Content queries take longer than metadata queries because of fuzzy matching.
-
- LQL or DQL?
-
-
When seeking help with log queries, refer to documentation related to LQL (Log Query Language). Note that this applies to the legacy Dynatrace log viewer, not the latest Log Monitoring UI.
-
Useful Links
-
Dynatrace Documentation: https://docs.dynatrace.com/managed/analyze-explore-automate
-
Log events (Logs Classic): https://docs.dynatrace.com/managed/analyze-explore-automate/log-monitoring/analyze-log-data/log-events
-
Log monitoring limits: https://docs.dynatrace.com/managed/analyze-explore-automate/log-monitoring/log-monitoring-limits
-
NGSS Production Dynatrace: https://hrt424.dynatrace-managed.com
-
NGSS SQA Dynatrace: https://cex678.dynatrace-managed.com